Experiment Objectives
By experiments, learn the basic principles of chromatographic analysis and the basic operation of the instrument, and understand the process of data analysis.
Learn about chromatographic quantitative methods and compare the advantages and disadvantages of different methods.
HPLC Introduction
High speed: HPLC uses high-pressure infusion equipment, the flow rate is greatly increased, and the analysis speed is extremely fast, only a few minutes generally; while the classical method depends on gravity feeding, it takes several hours to complete an analysis.
Efficient: The filler particles are very fine and regular, the coating on the stationary phase is uniform, and the mass transfer resistance is small, so the column efficiency is very high. It can complete the separation of hundreds of materials within minutes.
High sensitivity: The detector is extremely sensitive: UV- 10-9g, fluorescence detector- 10- 11g.
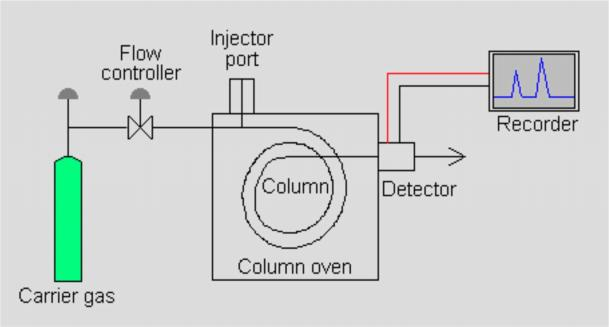
Comparison HPLC with GC
Object and scope of analysis: GC analysis is limited to gases and low-boiling stable compounds, which account for only 20% of the total organic matter; HPLC can analyze high-boiling, high-molecular-weight stable or unstable compounds that account for 80% of the total organic matter.
The choice of mobile phase: GC uses limited optional kinds of “inert” gases as the mobile phase, carry only, small effect on components. HPLC using the mobile phase is a mixture of liquid or various liquids, there are many kinds of optional mobile phase. In addition to its role as a carrier, it can also interact with the components and compete with the effect of stationary phase, that is, the contribution of mobile phase is much more for separation, and the separation can be controlled and improved by the solvent.
Operating temperature: GC requires high temperatures; HPLC is usually performed at room temperature.
Application fields
Due to its high sensitivity, quantitative accuracy, and suitable for analysis of non- volatile and thermally unstable components, HPLC separation analysis is extremely versatile in industrial and scientific research, especially in biology and medicine. For example, analysis of amino acids, proteins, nucleic acids, hydrocarbons, carbohydrates, drugs, polysaccharides, polymers, pesticides, sub-antibiotics, cholesterol, and metal organic are mostly done by HPLC.
HPLC structure and principle
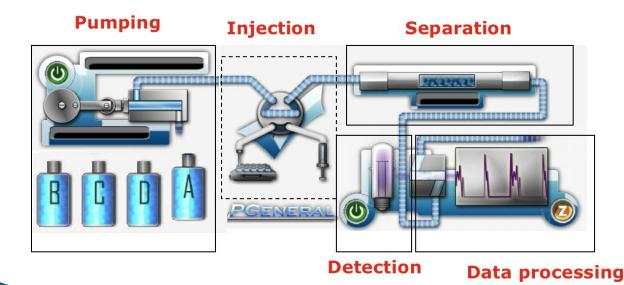
Fig. 1 HPLC Structure
HPLC consists of Pump system, injection system, separation system, detector and data processing system.
High-pressure infusion system
1) Mobile phase bottle: 1-2L glass bottle with solvent filter (Ni alloy), its pores are approximately 2 μm, preventing particulates from pumping.
2) Degasser: ultrasonic degassing or vacuum heating degassing. The solvent passes through the degassing membrane in the degasser, and the relatively small molecular weight gas is removed from the solvent through the membrane.
3) High-pressure pump: The requirements for the infusion pump: good sealing, stable flow without influx, wide adjustable range, and corrosion resistance.
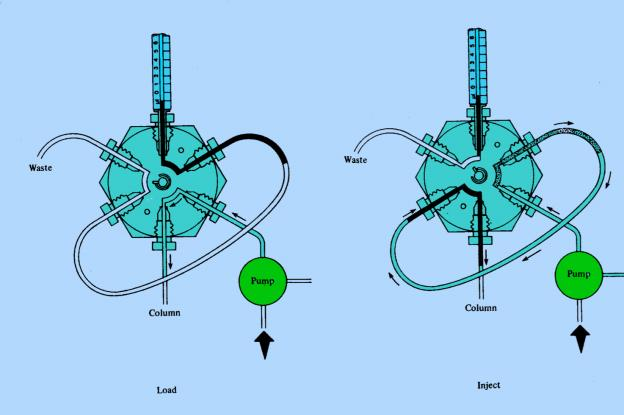
Injection system
Manual injector or auto-sampler
Fig.2 Injection principle
Column separation system
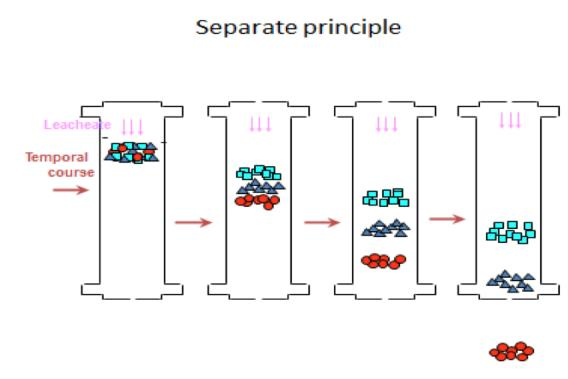
Fig.2 Separation principle
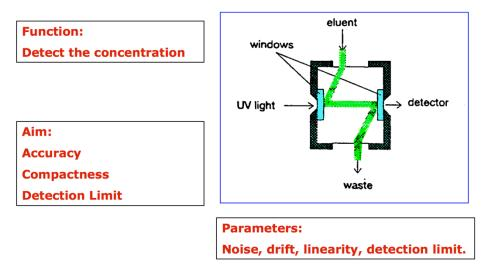
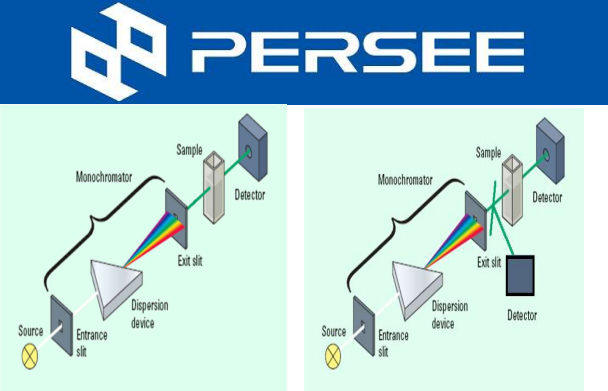
Fig.3 UVD
Separation principle
Chromatographic process: In systems with two immiscible phases, the mobile phase and the stationary phase, the third component (ie the solute or adsorbate) is continuously alternant distribution between the two phases.
Due to the differences in the property of the mobile phase, the stationary phase, and the solute mixture, the components show different chromatographic behaviors during the chromatographic process, so that the components are separated from each other.
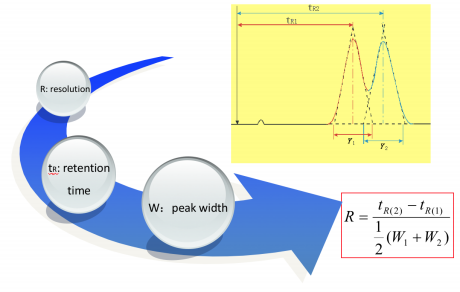
Resolution
The resolution of a elution is a quantitative measure of how well two elution peaks can be differentiated in a chromatographic separation. It is defined as the difference in retention times between the two peaks, divided by the combined widths of the elution peaks.
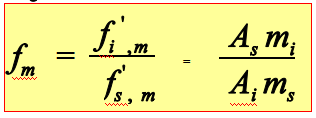
Correction factor
The quantitative analysis of chromatography is based on that the amount of component is proportional to the peak area:
Weight correction factor:
Quantitative method
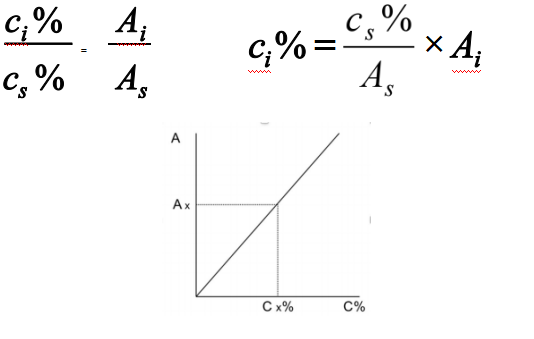
External standard method
Calibration curve can be established according to following equations:
Applied to regular analysis
Advantages: easy operation and calculation
Shortage: the accuracy of results depends on the repeatability of injection and stability of operating conditions. Quantitative injection is required for this method.
Internal standard method
Add certain amount of pure substance into the sample as internal standard.
Application range: only determine several components of the sample, and not all the peaks of components can be flowed
Advantages: less influence of operating conditions, much preciser, and less restrictions than normalization method, fit for trace analysis
Shortage: unfit for rapid analysis.
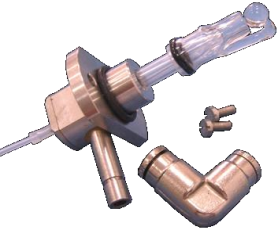
Syringe
The needle of the GC syringe is sharp and the needle of the LC syringe is flat. The two cannot exchange to use.
Experiment
Experimental conditions
1)Inject 10μL mix standard solutions (methyl paraben, propyl paraben, and butyl paraben) in different ratio mobile phases of methanol:water = 90:10, 80:20, and 70:30 to test, record retention time and the resolution between the various components, with the resolution greater than 1.5 and the shortest retention time as the principle of selecting the best mobile phase matching ratio.
Note: Each time you change the mobile phase, you need to wait about 5 minutes to balance the chromatographic system (both signal and pressure lines are balanced).
2) Inject 10 μL mix standard solutions (methyl paraben, propyl paraben, and butyl paraben) at different mobile phase flow rates of 0.8, 1.0, and 1.5 mL/min and optimal mobile phase ratios injection analysis, the same principle selected the best mobile phase flow rate.
Qualitative analysis
Under the optimal experimental conditions, inject 10 μL each of methyl paraben, propyl paraben, and butyl paraben and the retention time of each peak is recorded. Compared with the result obtained in step 2).
Quantitative analysis
Calibration curve
Under the optimal experimental conditions, 2, 5, 8, 10, 15, and 20 μL of the mixed standard sample was injected and analyzed, and the standard curve is established by injection volume and peak area.
It is required that the correlation coefficient of this curve is greater than 0.99. If it is not satisfied, retesting can be performed on experimental points that deviate significantly.
Unknown sample analysis
Inject 10 μL unknown sample to test, quantitative analysis by calibration curve. After analysis, wash the HPLC system with pure methanol about 10min, then shut off workstation and power switch.
Questions
Based on the experimental data, discuss the differences in analysis methods between gas chromatography and liquid chromatography.
Explore the application value of HPLC analysis.
Whether the UV detector is suitable for detecting all organic compound? Why?

